


Access, impact, and insights.
When it comes to every kid having access to youth sports, we don’t play around. With the support of our partners and donors, we’re helping tens of thousands of kids get in the game.
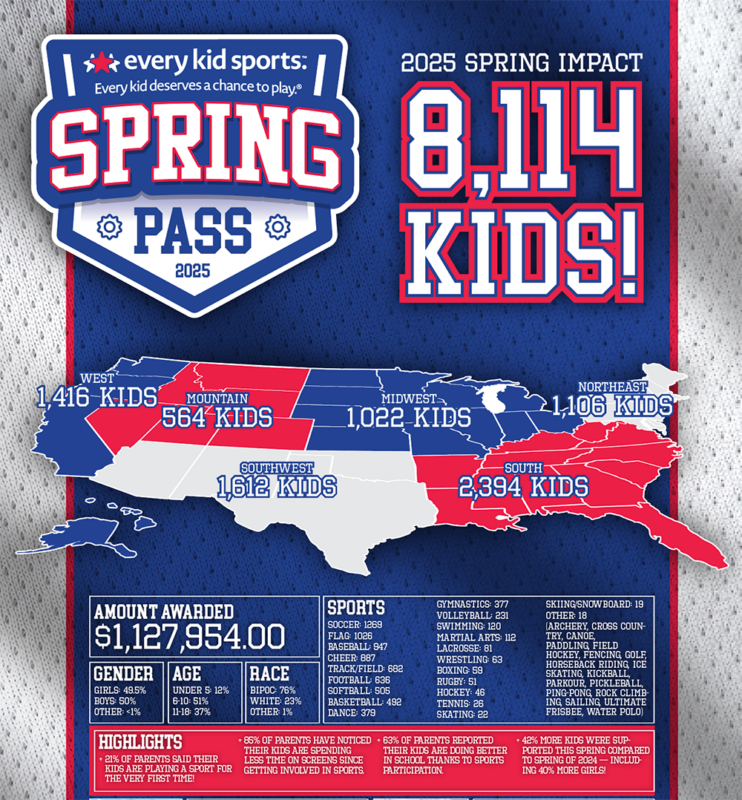
Spring 2025 impact numbers are in. Over 8,000 more kids have been provided access to sports!
Thanks to all our sponsors and donors, we’ve helped 8,114 kids access sports through our Spring 2025 Pass. Please click on the image below to download a PDF of our Spring 2025 Impact Report. If moved to so, consider making a donation to ensure our Fall 2025 Pass is even more impactful. Thank you!
The Spring 2025 numbers at-a-glance:
8,114
Total # of kids provided access to play
$1,127,954.00
Total amount of funding distributed
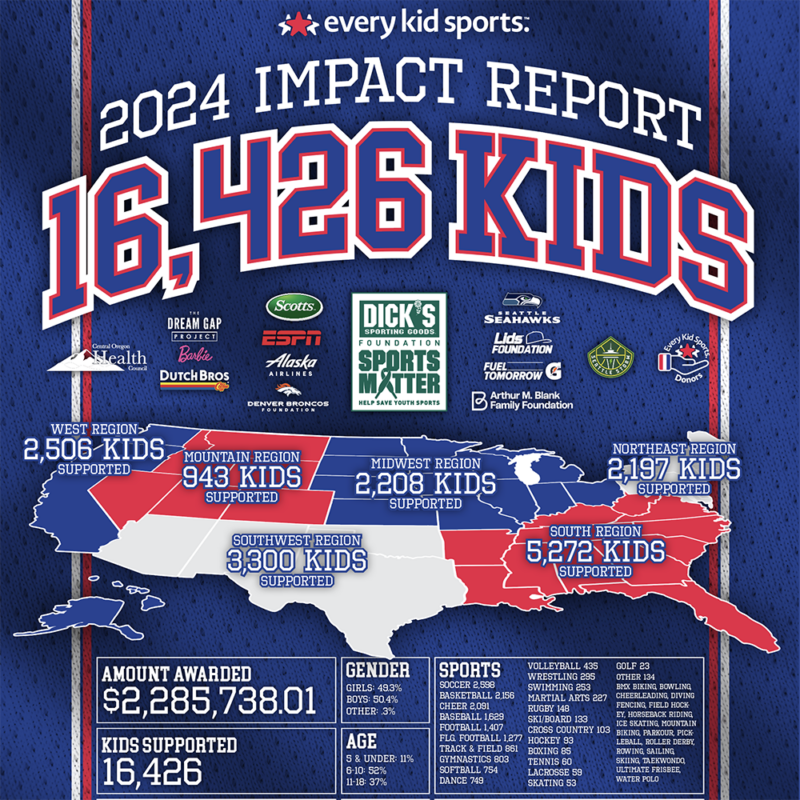
2024 impact numbers are in. Over 16,400 kids have been provided access to sports!
Thanks to all our sponsors and donors, we’ve helped 16,426 kids access sports in 2024. Please click on the image below to download a PDF of our 2024 Impact Report. If moved to so, consider making a donation to ensure our Spring 2025 Pass is even more impactful. Thank you!
The 2024 numbers at-a-glance:
16,426
Total # of kids provided access to play
$2,285,738.01
Total amount of funding distributed
$139.15
Average grant amount
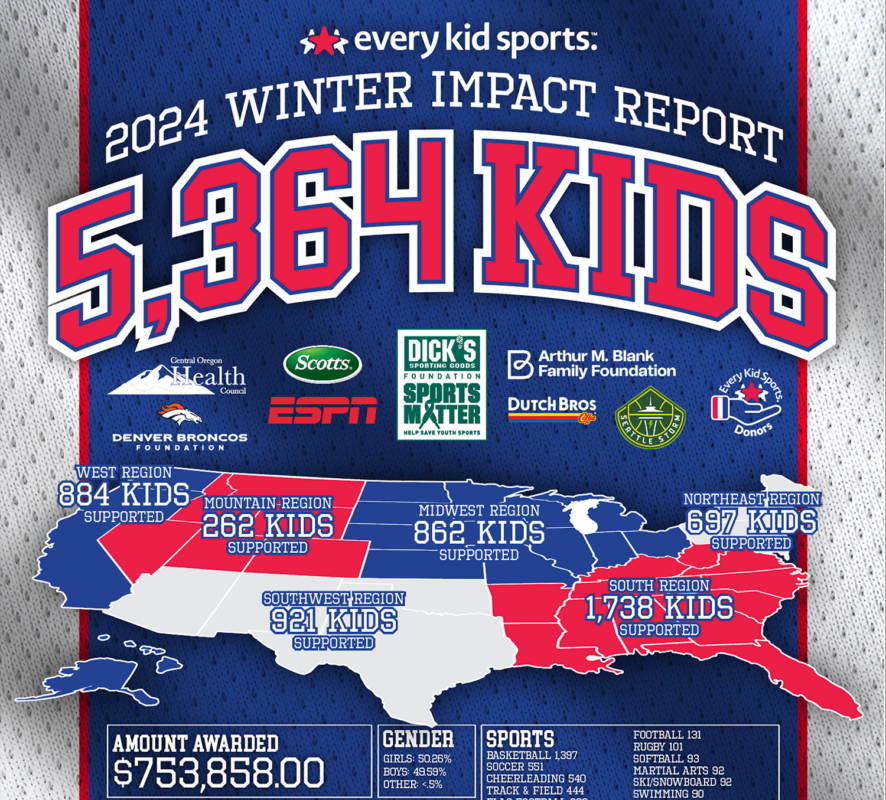
Winter 2024 impact numbers are in. Over 5,300 kids have been provided access to sports!
The Winter 2024 numbers at-a-glance:
5,364
Total # of kids provided access to play
$753,858.00
Total amount of funding distributed
$140.54
Average grant amount
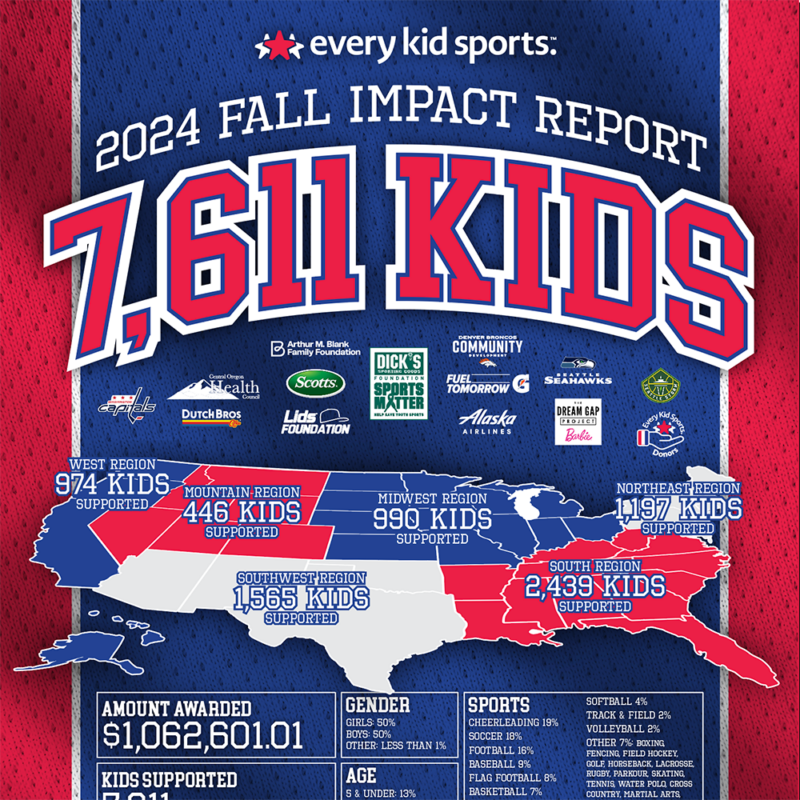
Fall 2024 impact numbers are in. Over 7,600 kids have been provided access to sports!
The Fall 2024 numbers at-a-glance:
7,611
Total # of kids provided access to play
$1,062,601.01
Total amount of funding distributed
$139.61
Average grant amount
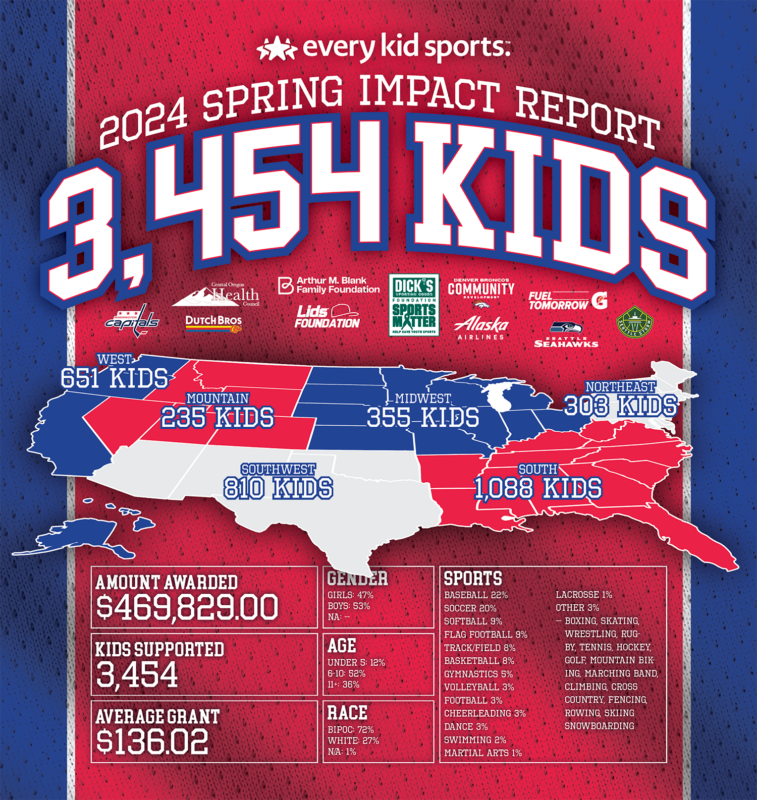
2024 Spring impact numbers are in. Nearly 3,500 kids are in, too.
The 2024 Spring numbers at-a-glance:
3,454
Total # of kids provided access to play
$469,829.00
Total amount of funding distributed
$136.02
Average grant amount
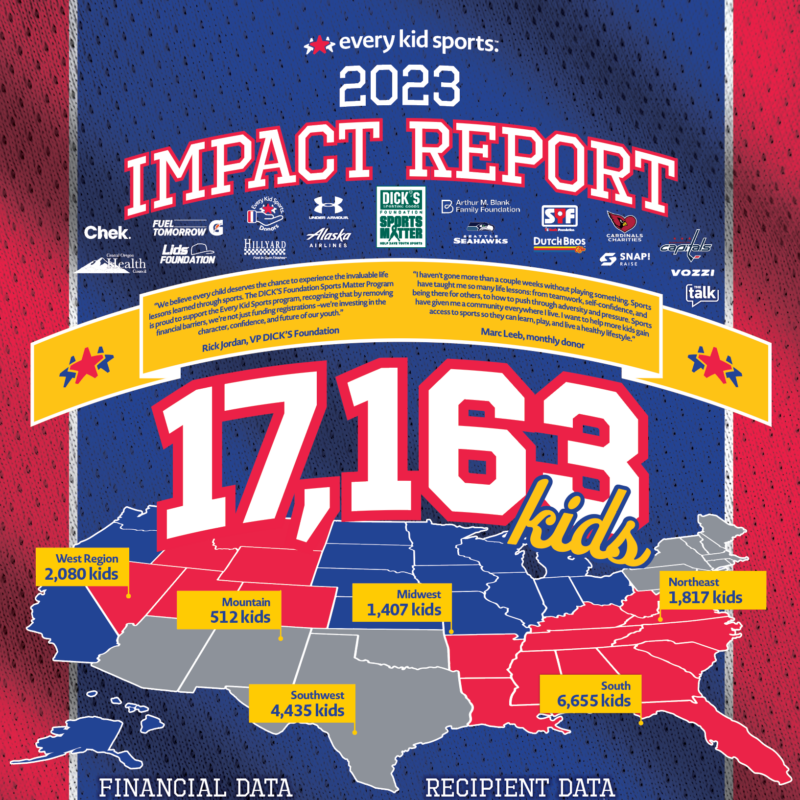
2023 impact numbers are in. Over 17,000 kids are in, too.
The 2023 numbers at-a-glance:
17,163
Total # of kids provided access to play
$2,362,801.38
Total amount of funding distributed
$139.97
Average grant amount
2023 – 2021 impact reports
The 2023 numbers at-a-glance:
17,163
Total # of kids provided access to play
$2,362,801.38
Total amount of funding distributed
$139.97
Average grant amount
The 2022 numbers at-a-glance:
47,890
Total # of kids provided access to play
$6,100,102.69
Total amount of funding distributed
$127.38
Average grant amount
The 2021 numbers at-a-glance:
33,780
Total # of kids provided access to play
$4,421,367.00
Total amount of funding distributed
$130.88
Average grant amount